 Tabs - Therapeutic Antibody Database
The TABS antibody database is the most comprehensive database of Therapeutic Antibodies under development against Human Antigens.
The following charts summarize important trends in this field.
You are free to use these figures in your own presentations as long as you agree to these two simple conditions:
1: You must not remove the text that credits the TABS Antibody Database from the images
2: You should understand the caveats associated with the data in each chart, as described below.
You do not need to be a subscriber to TABS to use the charts, but you are encouraged to sign up for a free 30 demo account to TABS
The charts are distributed as PNG files which you can resize to suit your needs.
These charts were last updated in November 2019.
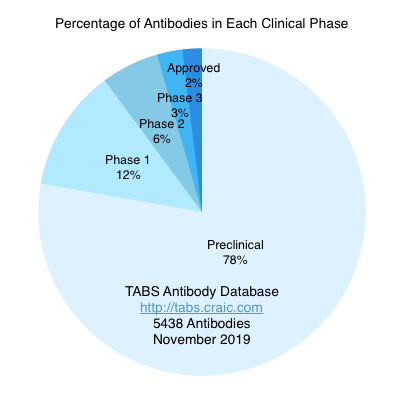
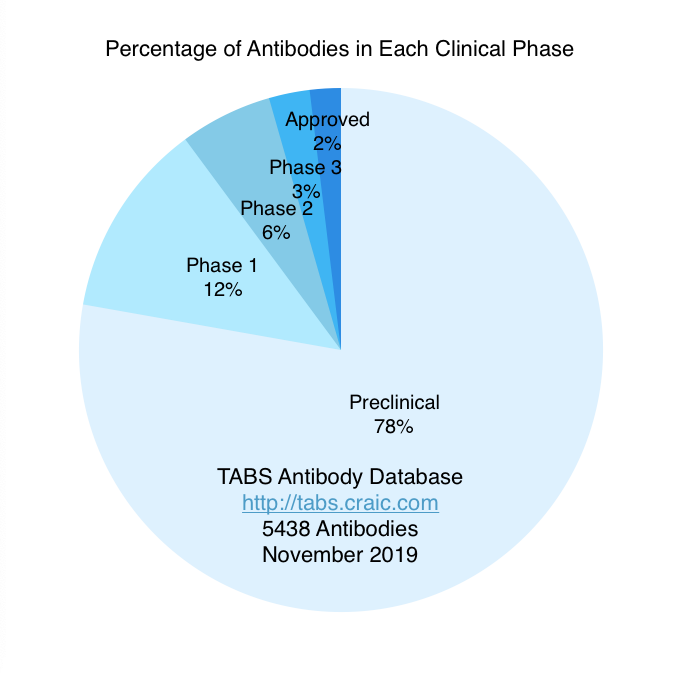
ANTIBODIES in each Development PHASE
This chart shows the percentage of all the mAbs currently in TABS in each development phase, from preclinical through to FDA approval.
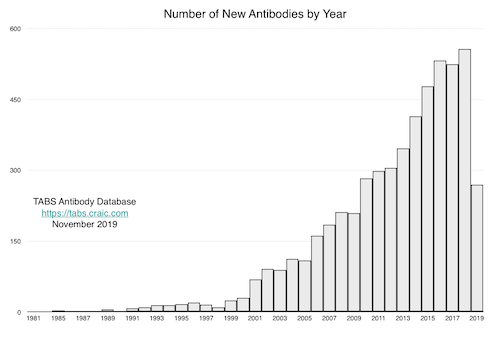
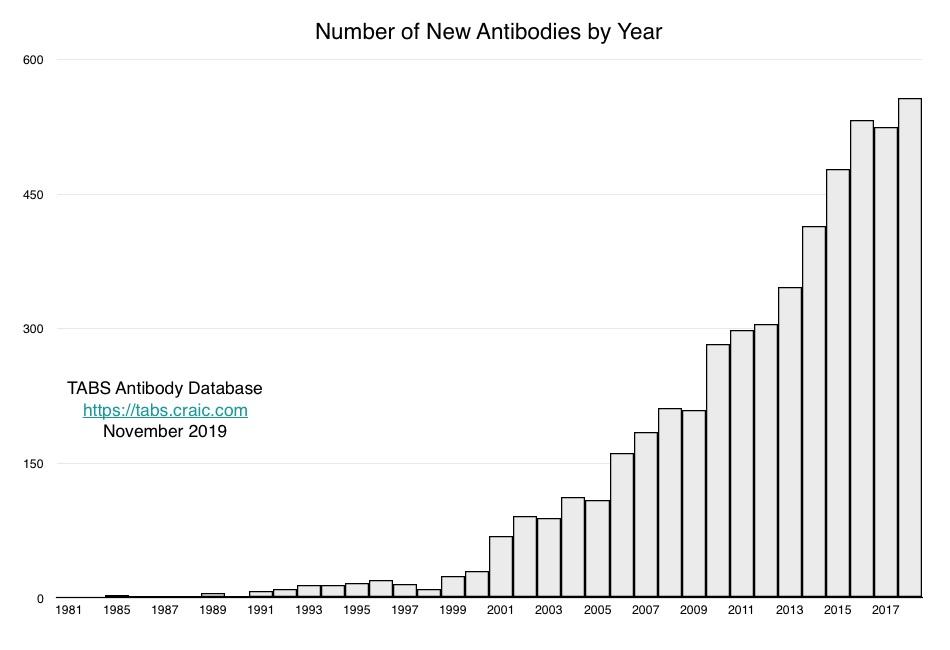
Number of New ANTIBODIES per Year
This chart shows the number of new antibodies that have had their first public disclosure in each year.
NOTE: TABS records data from various public sources, such as papers, patents, meeting abstracts, etc. The earliest date recorded for a given antibody defines the year in which it appears in the chart. TABS records the Filing Date for each patent, which is often the first disclosure. However there is a lag of typically a YEAR between filing and the publication of a patent.
The means that this chart lags behind the real data by perhaps a year. In particular, the count for the Current Year will appear MUCH LOWER than the probable reality.
Do not assume that antibody development has declined in the past two years.
Download Large version – WITH 2019
Download Large version – WITHOUT 2019
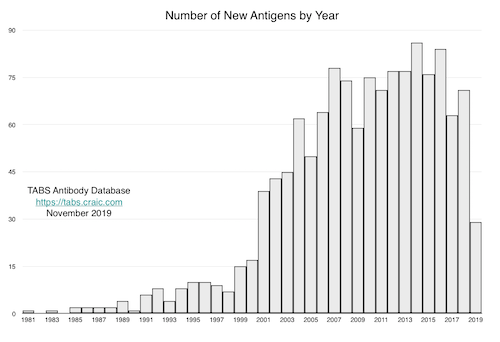
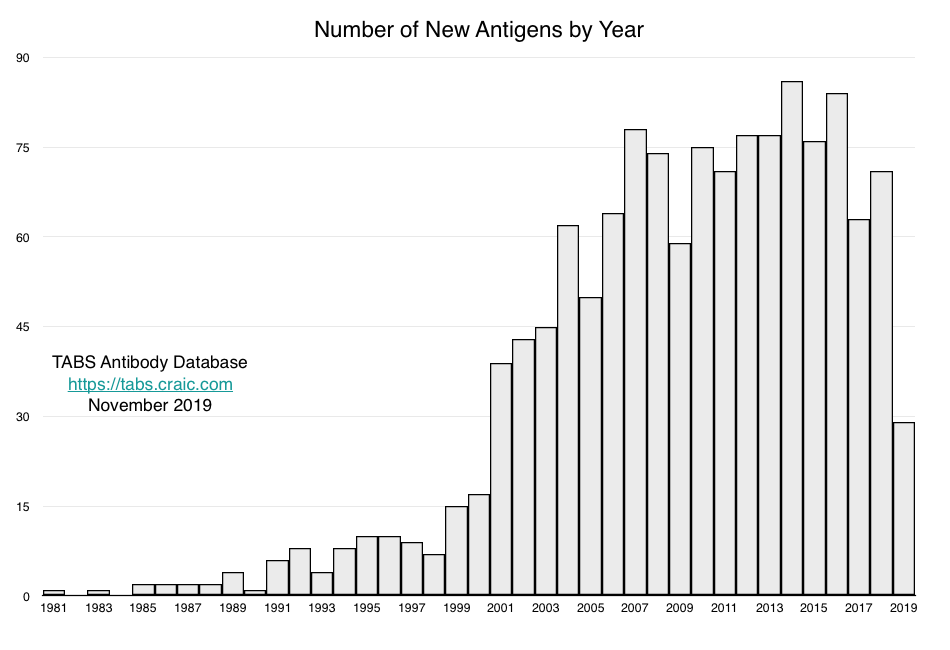
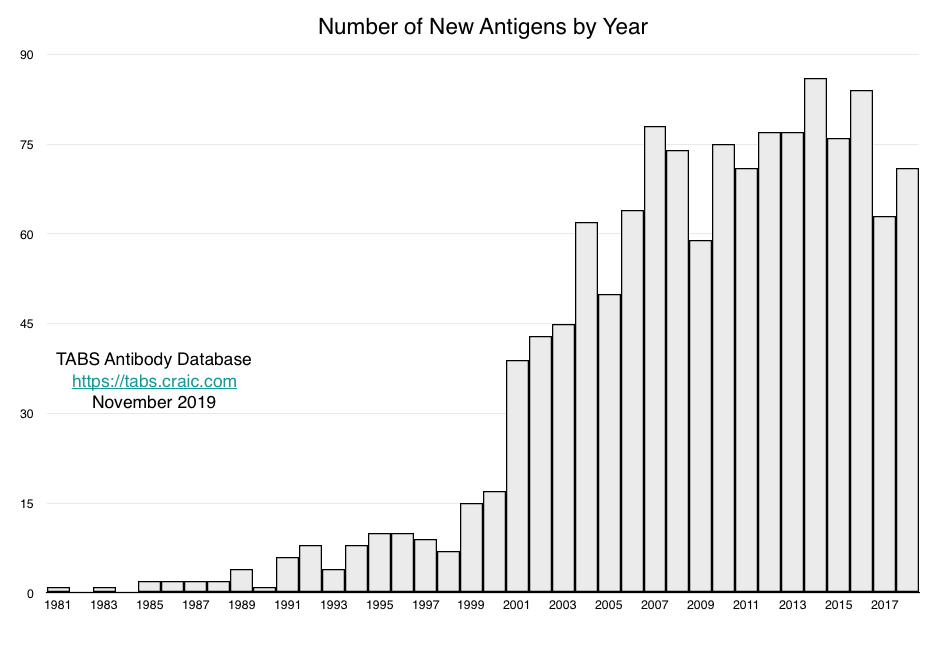
Number of New ANTIGENS per Year
This chart shows the number of new Antigens against which new Antibodies have been developed, based on the first disclosure of the first antibody to target each antigen.
NOTE: TABS records data from various public sources, such as papers, patents, meeting abstracts, etc. The earliest date recorded for a given antibody defines the year in which it appears in the chart. TABS records the Filing Date for each patent, which is often the first disclosure. However there is a lag of typically a YEAR between filing and the publication of a patent.
The means that this chart lags behind the real data by perhaps a year. In particular, the count for the Current Year will appear MUCH LOWER than the probable reality.
Download Large version – WITH 2019
Download Large version – WITHOUT 2019
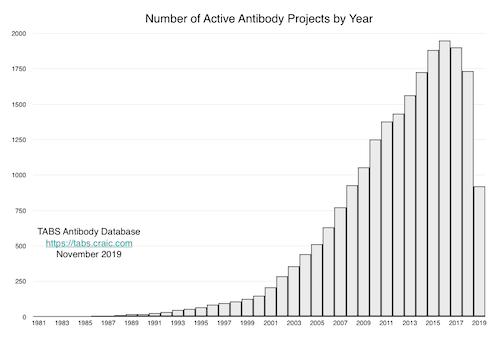
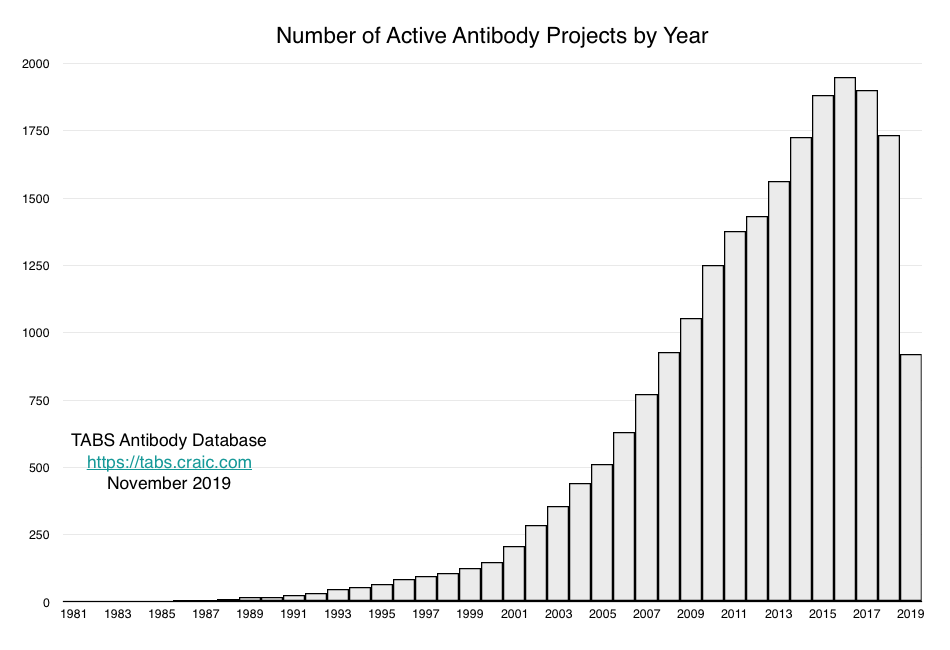
Number of ACTIVE Antibody Projects per Year
This chart shows the number of Antibodies for which one or more disclosure events have been recorded in a given year.
This is a way of representing the number of active antibody development projects in each year.
NOTE: TABS records data from various public sources, such as papers, patents, meeting abstracts, etc. The earliest date recorded for a given antibody defines the year in which it appears in the chart. TABS records the Filing Date for each patent, which is often the first disclosure. However there is a lag of typically a YEAR between filing and the publication of a patent.
In addition, papers describing clinical trials often appear a year or more after the end of the trial and by this time work on the antibody may have been discontinued.
The means that this chart lags behind the real data by perhaps a year. In particular, the count for the Current Year will appear MUCH LOWER than the probable reality.
Download Large version – WITH 2019
Download Large version – WITHOUT 2019
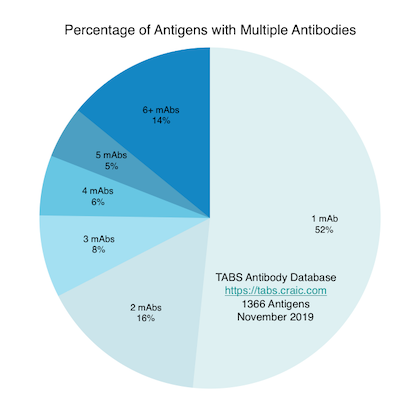
Number of ANTIBODIES per ANTIGEN
This chart shows the percentage of Antigens that are targeted by one or more Antibodies.
This is a way of representing the apparent competition between companies working on the same antigens.
The number of antibodies being developed against each of the Antigens in the database was calculated. The pie chart shows 6 categories – from antigens with a single antibody targeting it through to a composite category where there are 6 or more antibodies targeting those antigens.